Earthquake catalog development
Locating Himalayan Microseismicity
An earthquake-catalog workflow combining machine learning–based phase detection with association and relocation of small Himalayan earthquakes.
- Machine Learning
- Signal Analysis
- Earthquake Location
Research question
How can machine learning help extract small-earthquake signals from continuous seismic data and turn detections into physically interpretable event locations?
Study design
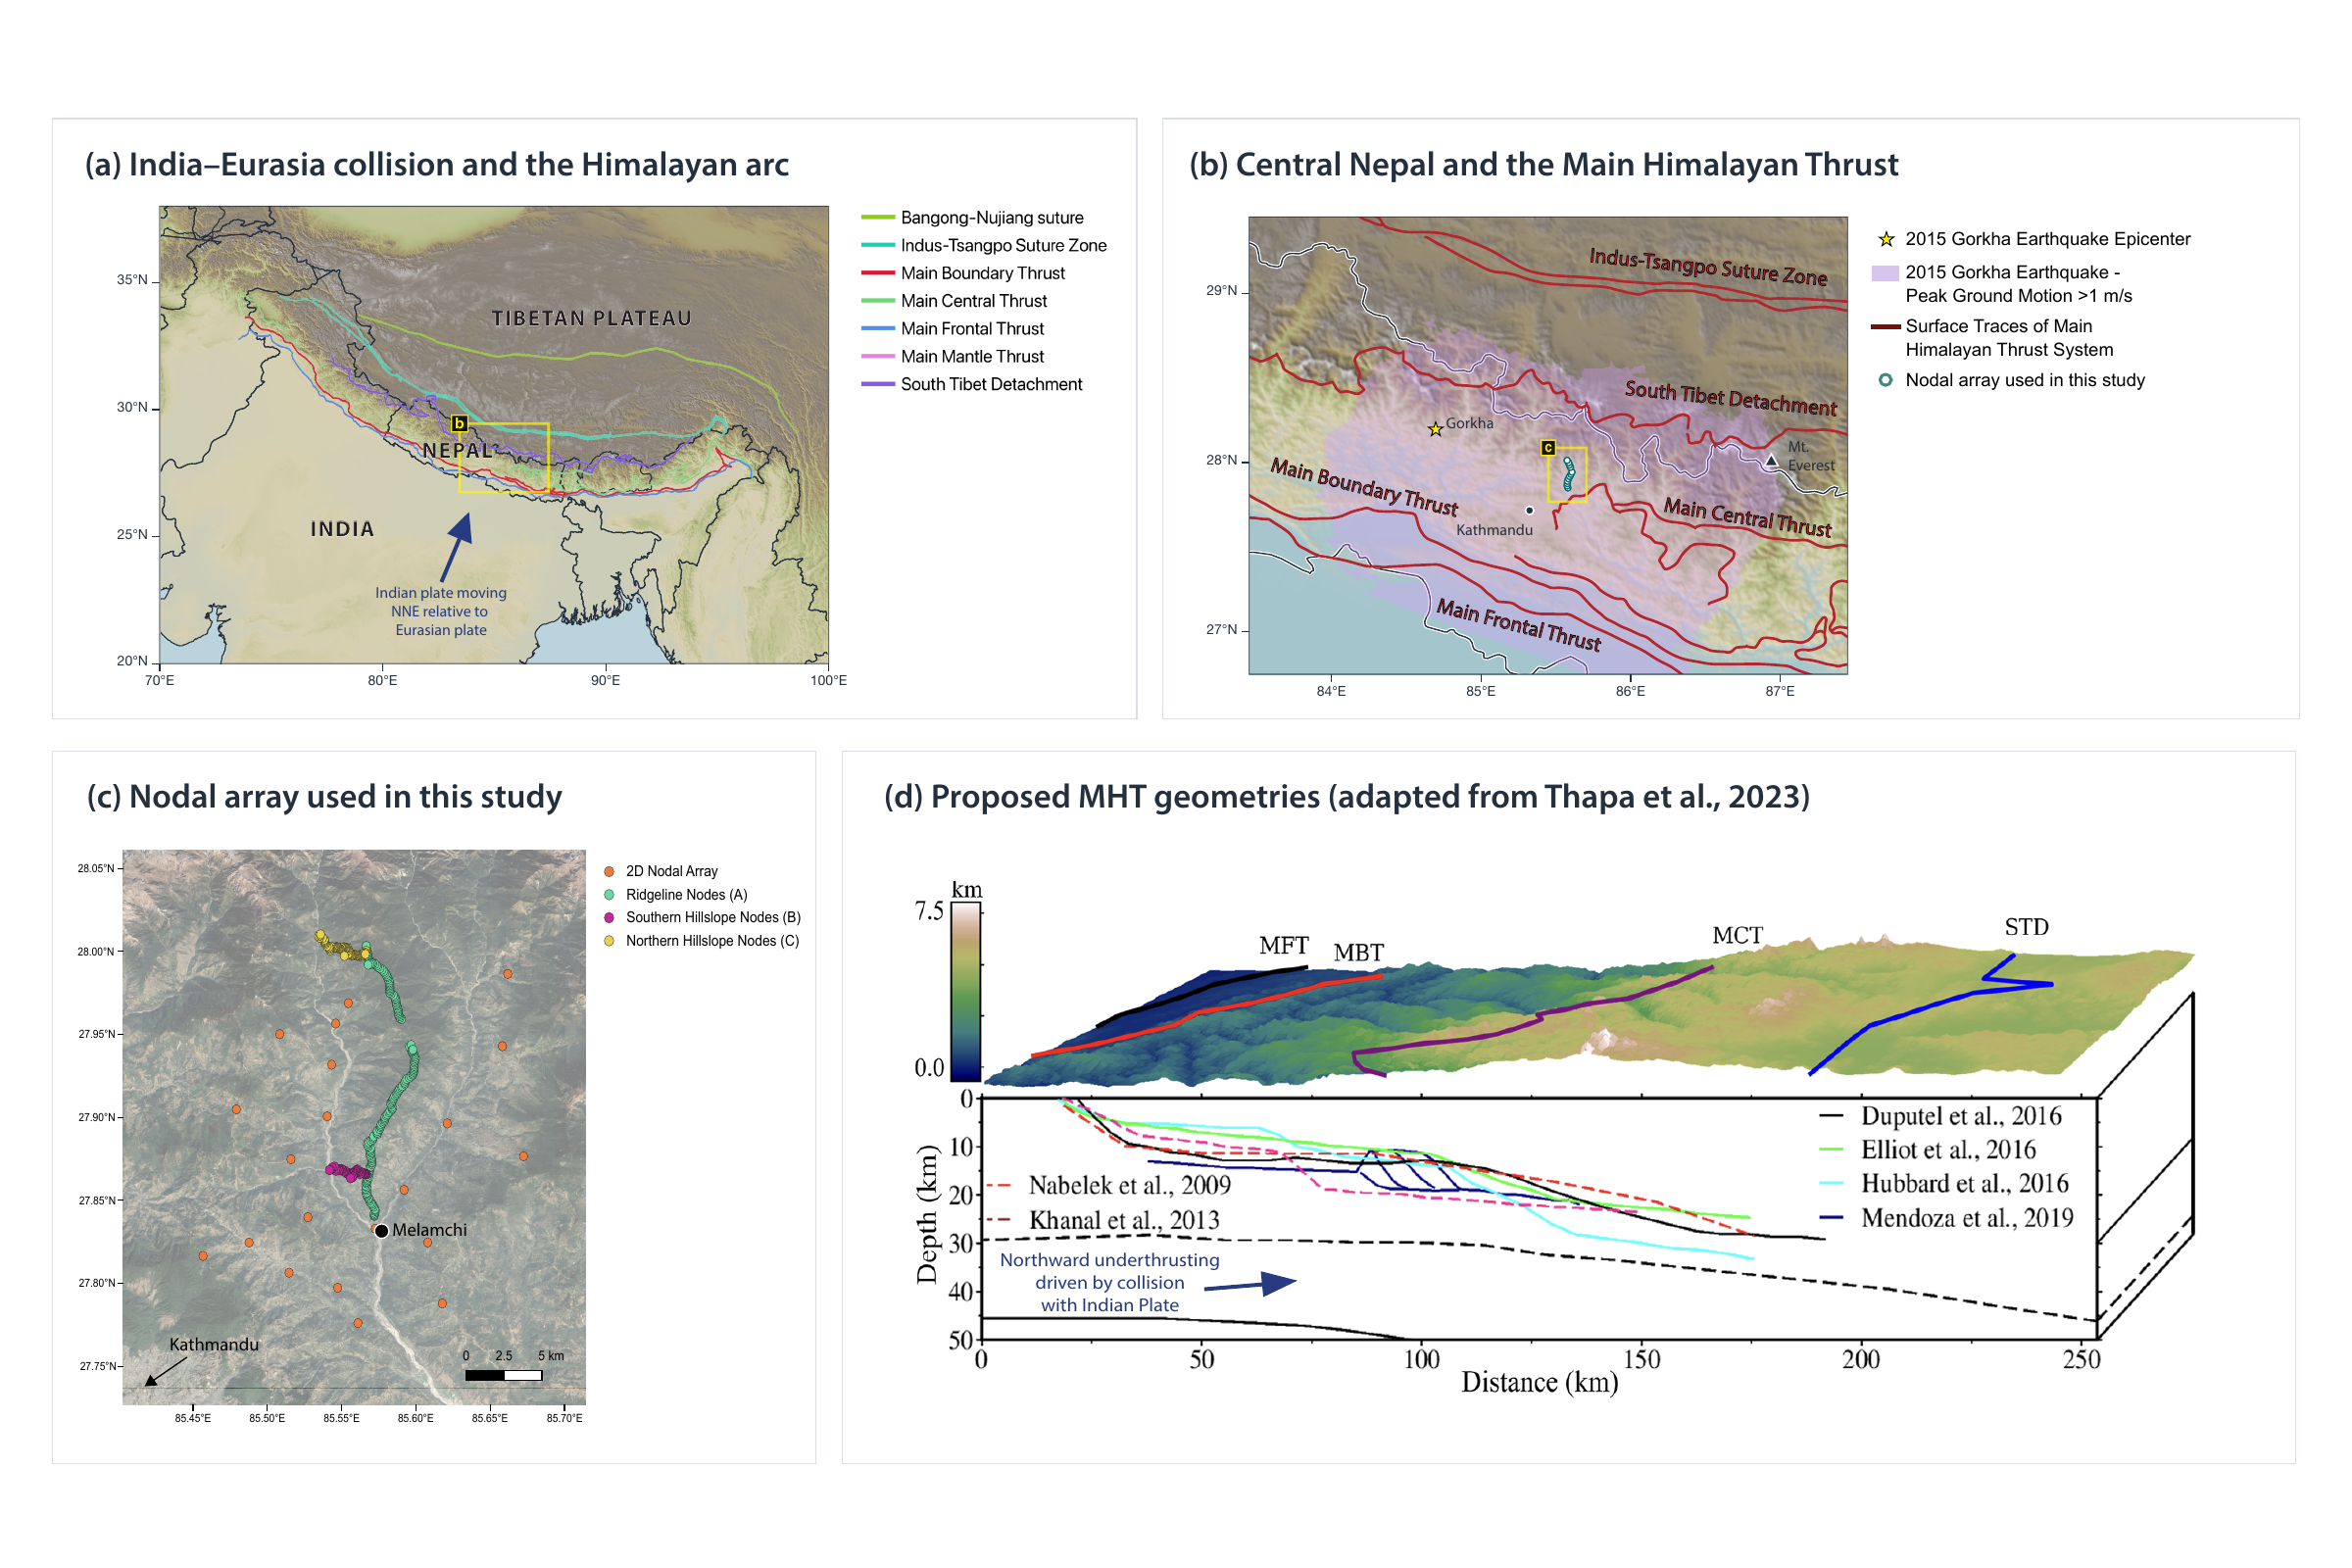
I developed an earthquake-catalog workflow that connects machine learning–based phase picking with phase association, absolute location, and double-difference relocation. The dense seismic array near Melamchi provides observations within the central Nepal Himalaya. I use these records to turn candidate arrivals into an earthquake catalog and examine the distribution of seismicity in its regional tectonic setting.
Workflow highlights
Machine learning turns continuous records into phase picks
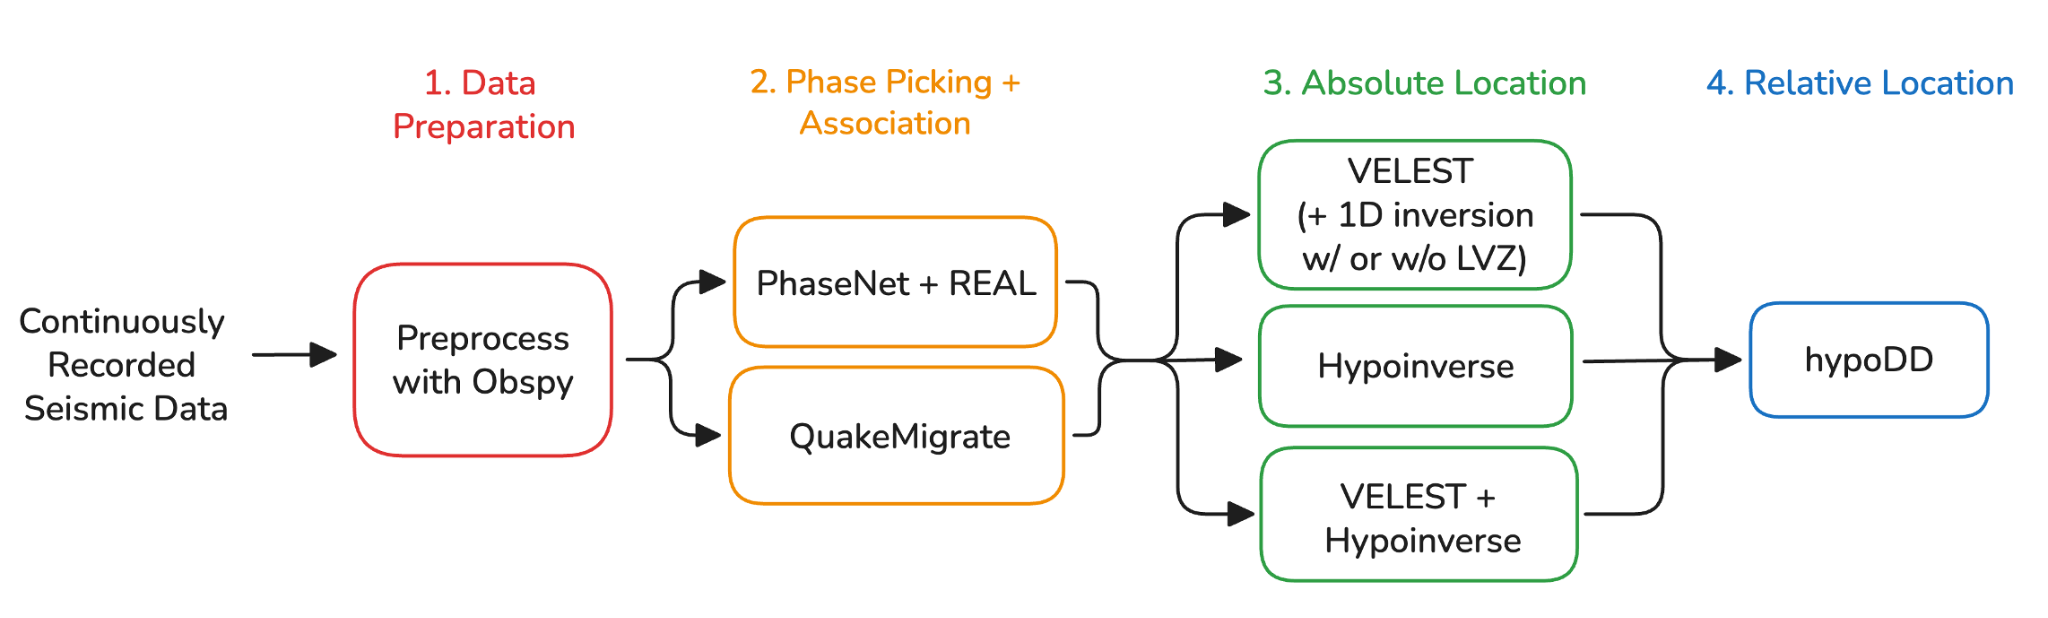
PhaseNet identifies candidate seismic arrivals, and REAL associates picks across stations into events. The workflow also includes QuakeMigrate as an alternative detection and location approach.
Velocity models connect arrival times to earthquake locations
The location workflow includes VELEST, Hypoinverse, and a combined approach. VELEST also supports one-dimensional velocity-model inversion, including models with and without a low-velocity zone.
Relative locations reveal the catalog’s spatial structure
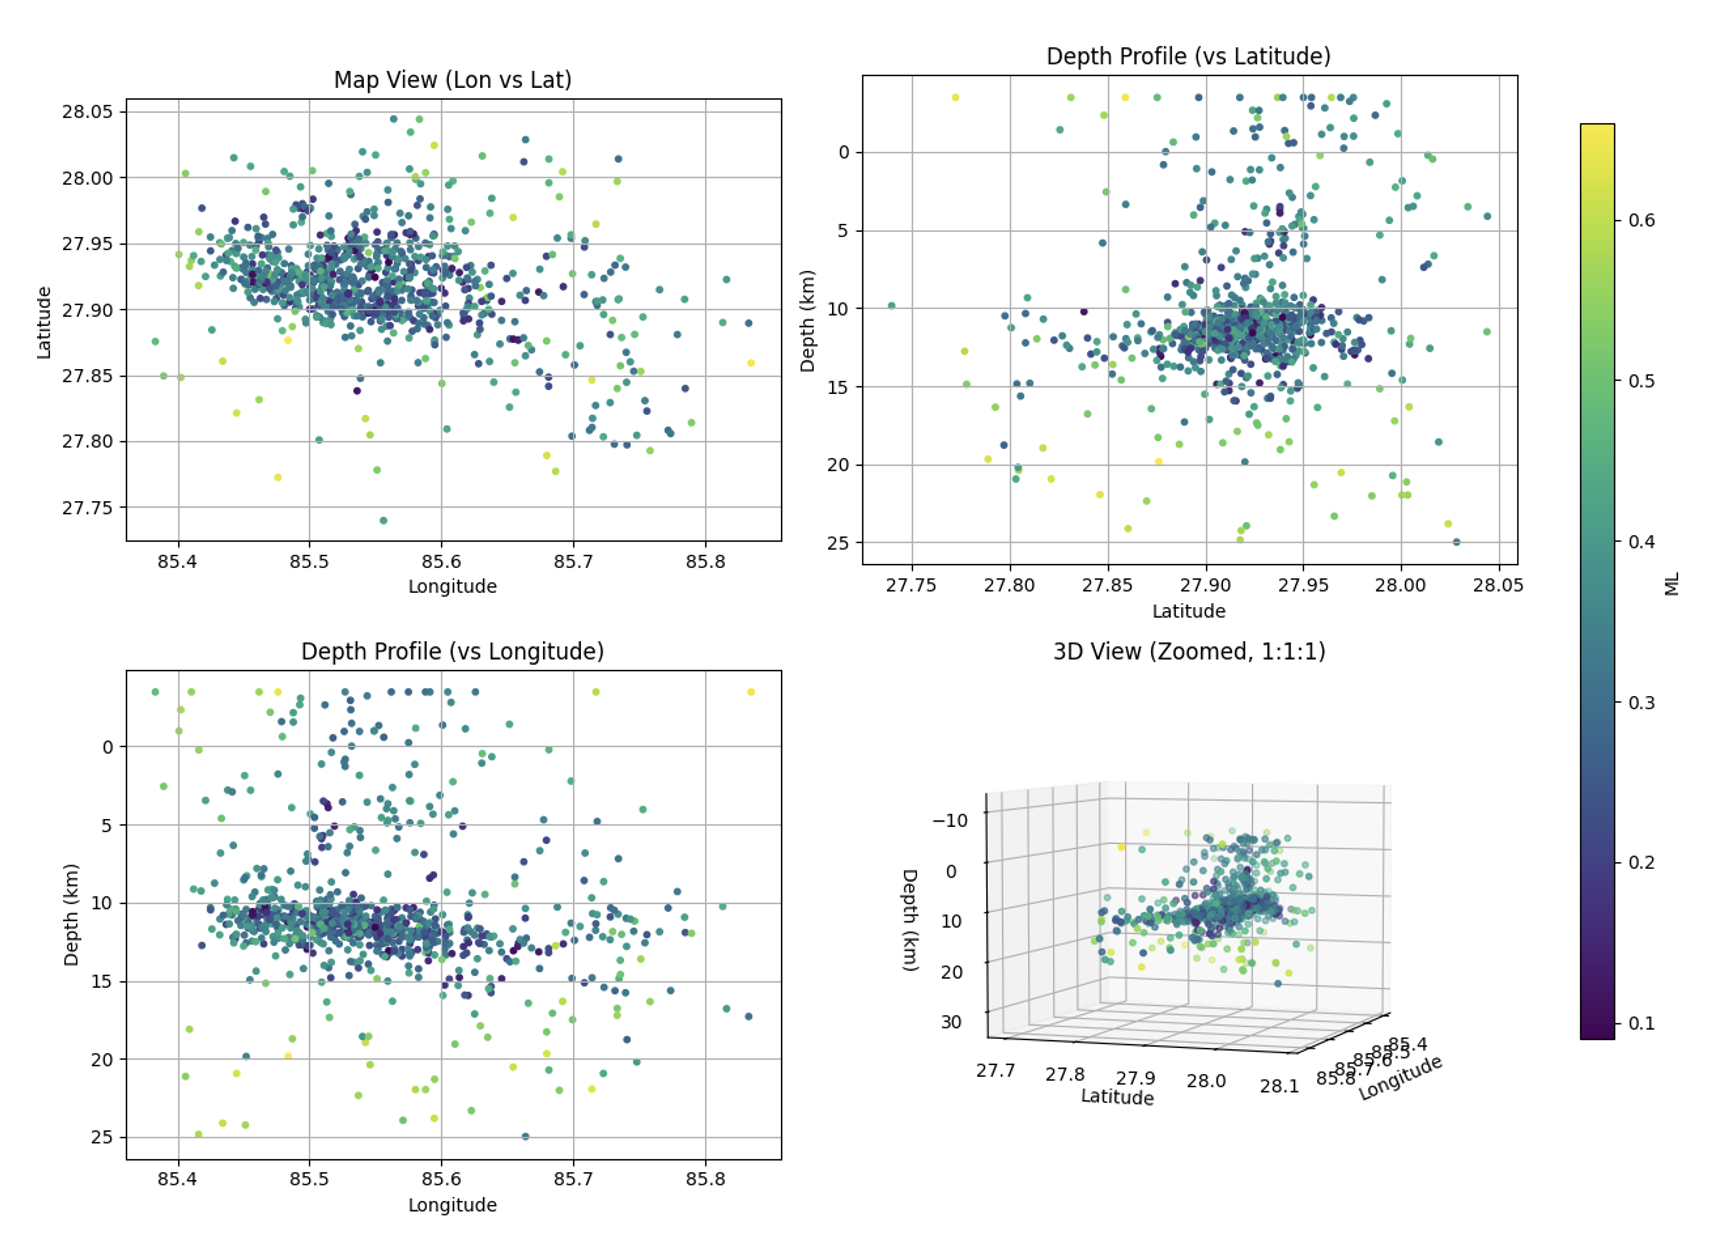
Double-difference relocation with hypoDD refines the relative positions of nearby earthquakes. Map, depth, and three-dimensional views then bring the resulting spatial distribution into focus.
Detailed methods
1. Prepare continuous waveform data
I preprocess the continuously recorded seismic data with ObsPy to provide the waveform inputs for phase detection and event association.
2. Detect phases and associate events
The machine-learning branch uses PhaseNet for seismic phase picking and REAL to group arrivals across stations. QuakeMigrate provides an alternative branch of the workflow. These steps connect individual waveform detections to candidate earthquakes.
3. Estimate absolute locations and velocity structure
The workflow includes VELEST, Hypoinverse, and a combined VELEST–Hypoinverse route. In the VELEST branch, earthquake location is paired with one-dimensional velocity inversion, with options that include or omit a low-velocity zone.
4. Refine relative locations
The absolute-location branches feed into hypoDD for double-difference relocation. Relative arrival-time information refines the spatial relationships among nearby events, producing the catalog shown in the map and depth projections.
Why it matters
This project demonstrates how I integrate machine-learning tools into a scientific analysis: converting automated detections into a structured data product that can support questions about the distribution of seismicity.